
Platform
From the shop floor to the improvement plan.
PerforaScan links your shop-floor evidence to a structured diagnostic, then to actions your managers choose, assign and track.
The journey
- 01–05DiagnoseContext, questionnaire, evidence, findings, pillars
- 06–07DecideSummaries and roadmaps
- 08–09ExecuteKanban, tracking and reports
The journey, step by step
Nine steps, all in the application.
01
Company context
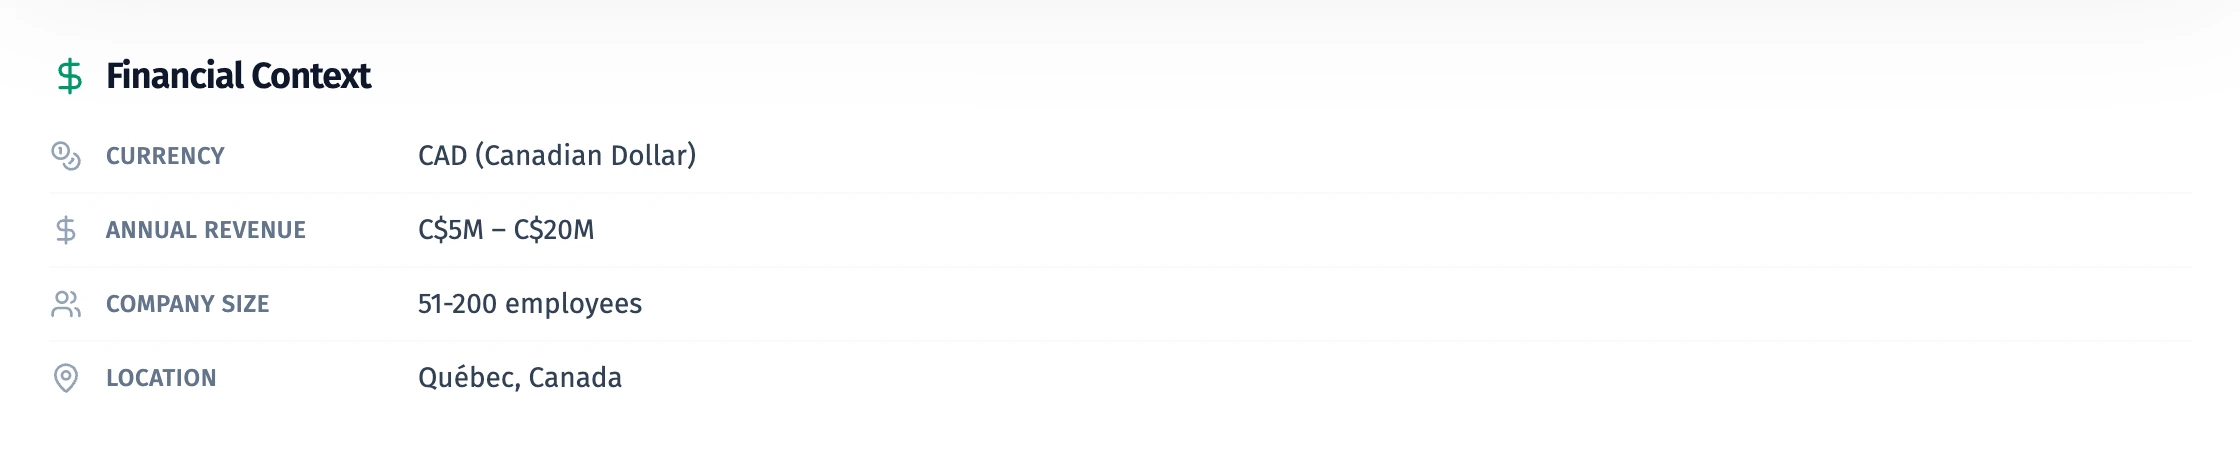
Every scan belongs to a site. The company context (currency, revenue, size and location) frames the analysis.
02
Structured questionnaire
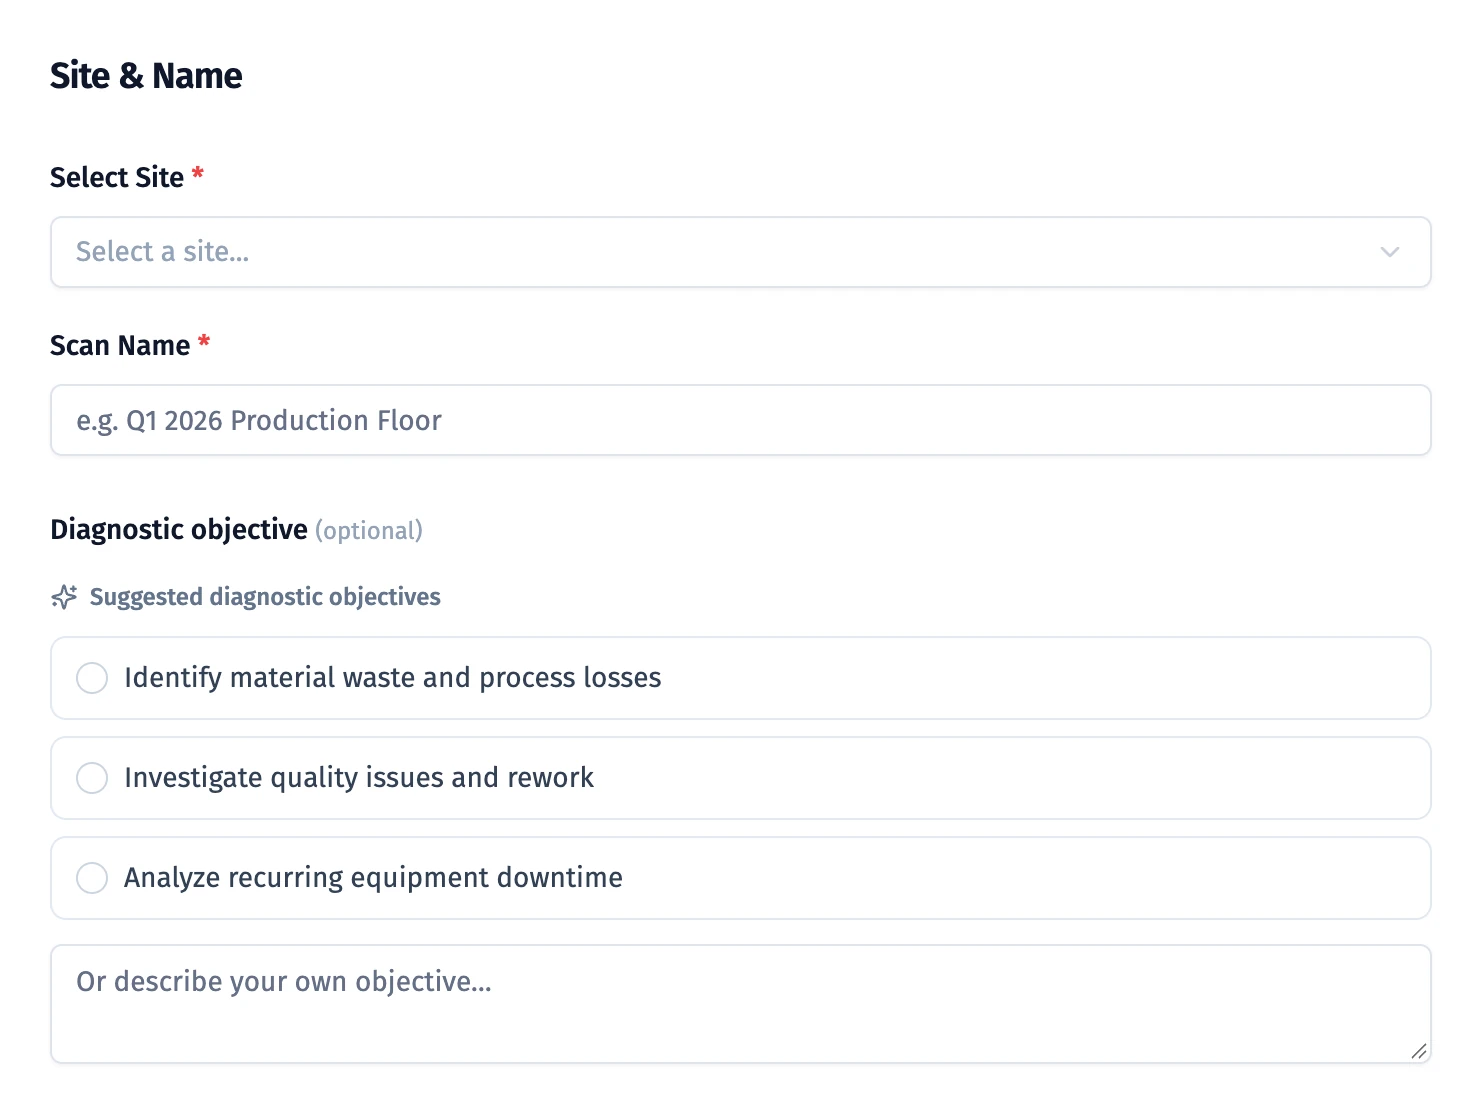
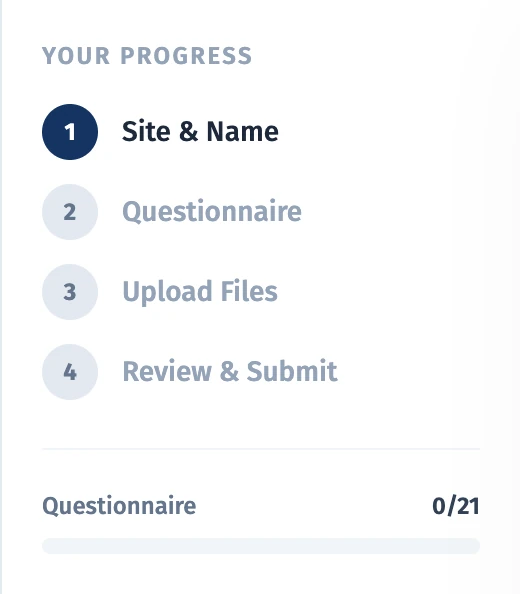
A new scan has four steps: site and name, a 21-question questionnaire, file upload and review. You can state the objective of the diagnostic.
03
Photos, videos and evidence
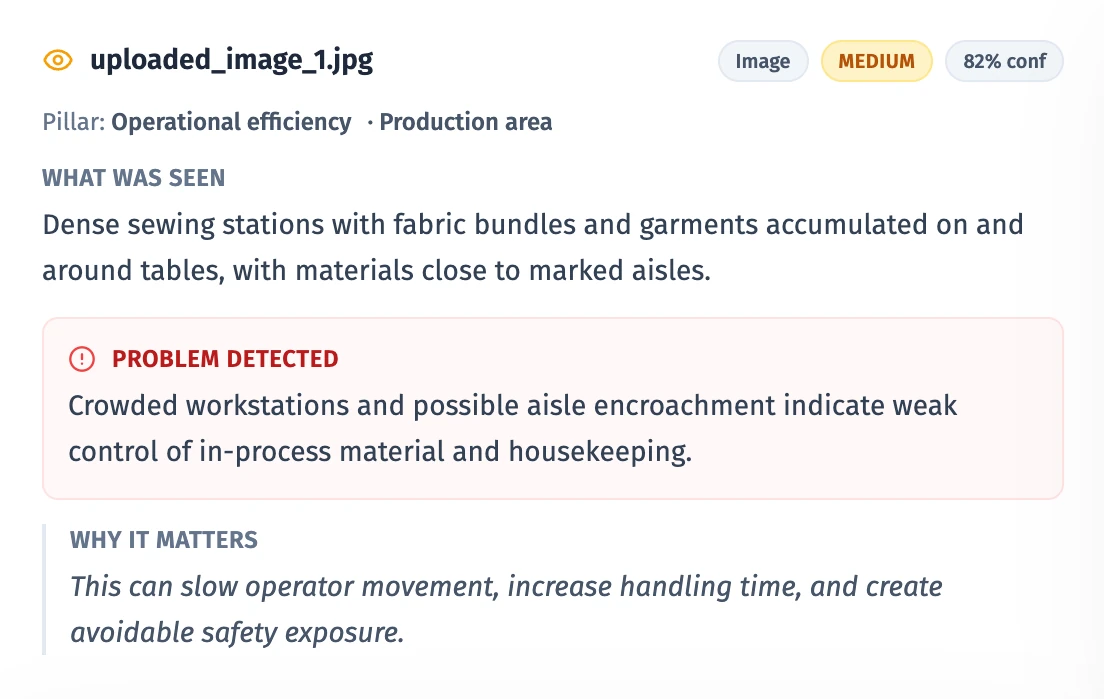
You upload photos and videos of your shop floor. For each one, PerforaScan describes what it observed, the problem detected and why it matters, with a confidence level.
04
AI-assisted findings
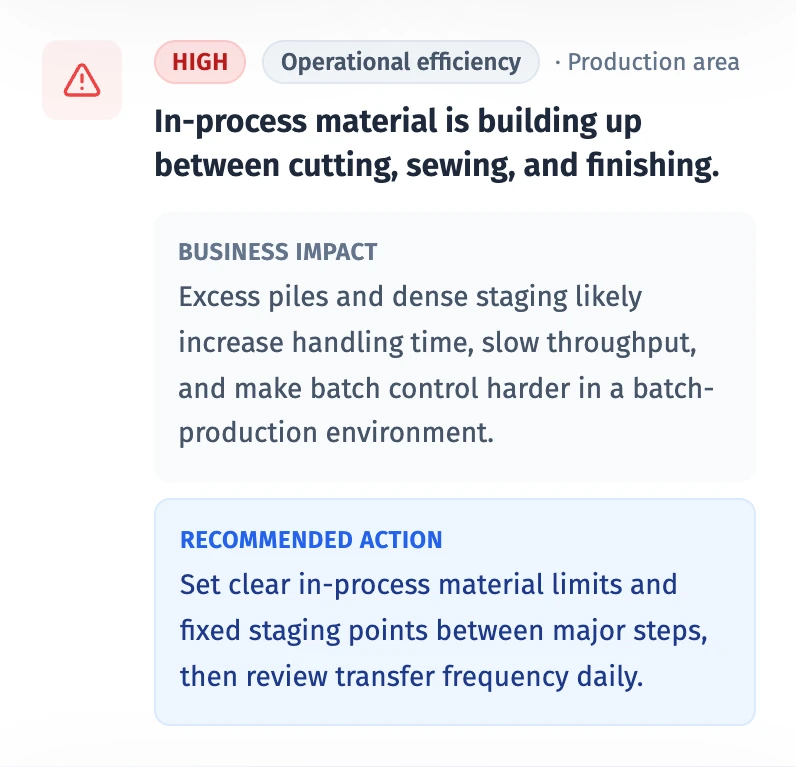
Findings are ranked by severity. Each one states its pillar, its business impact and the recommended action.

05
Six pillars and root causes
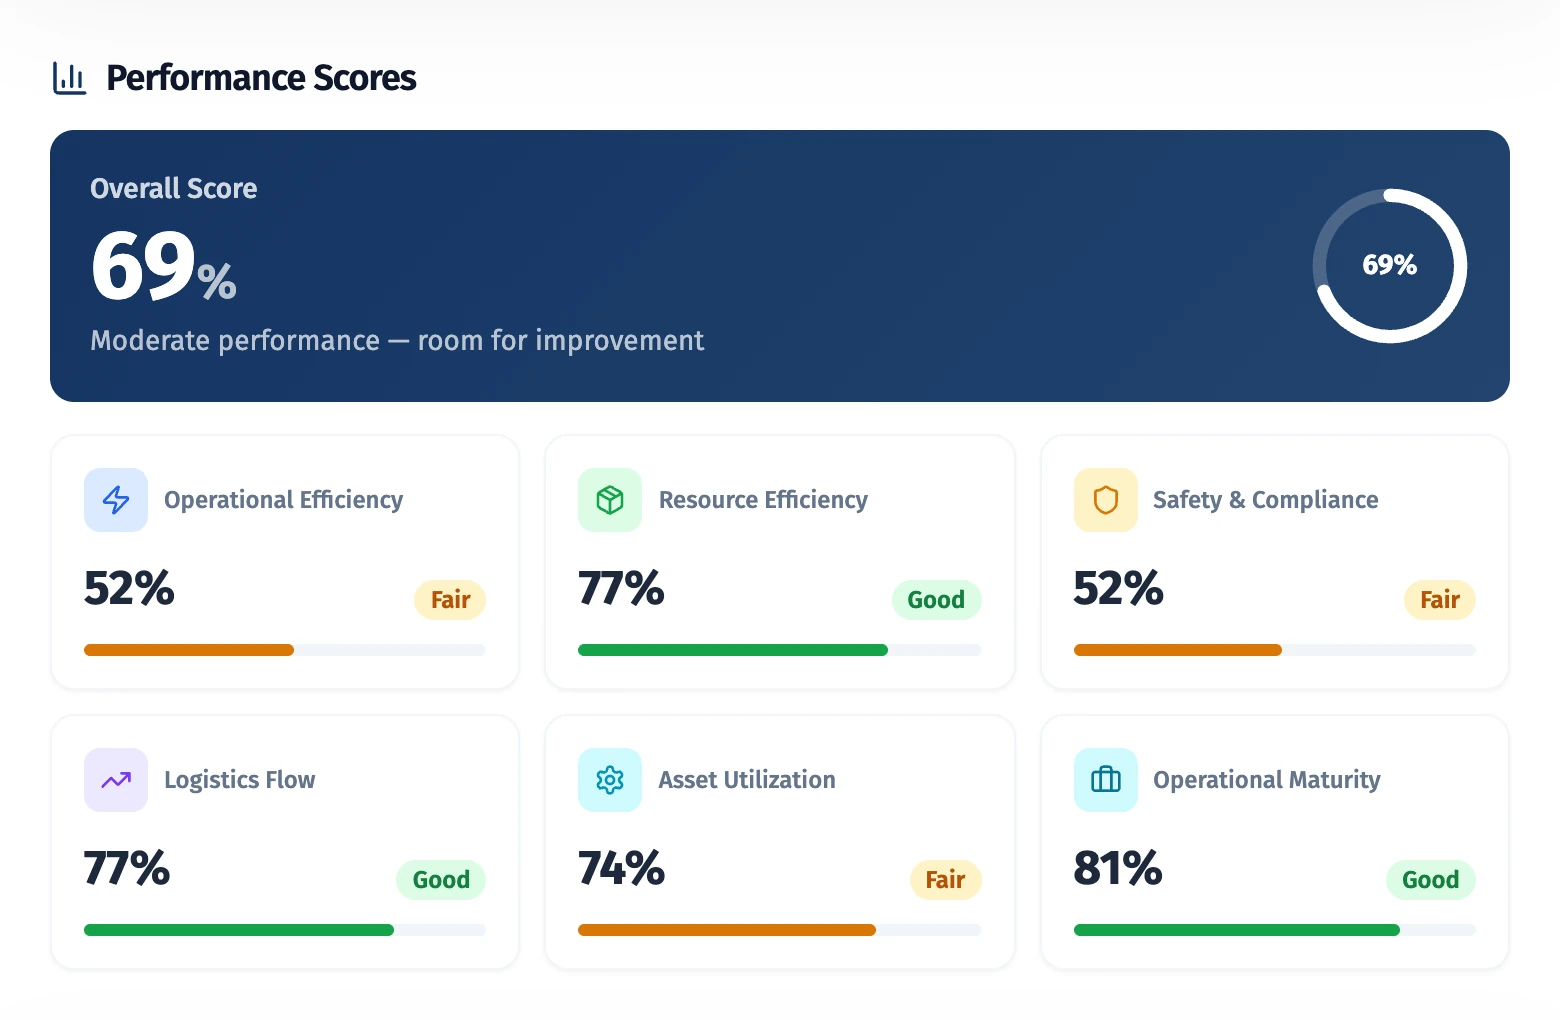
The overall score breaks down into six performance pillars. Root causes explain why the problems persist.

06
Summaries and recommendations
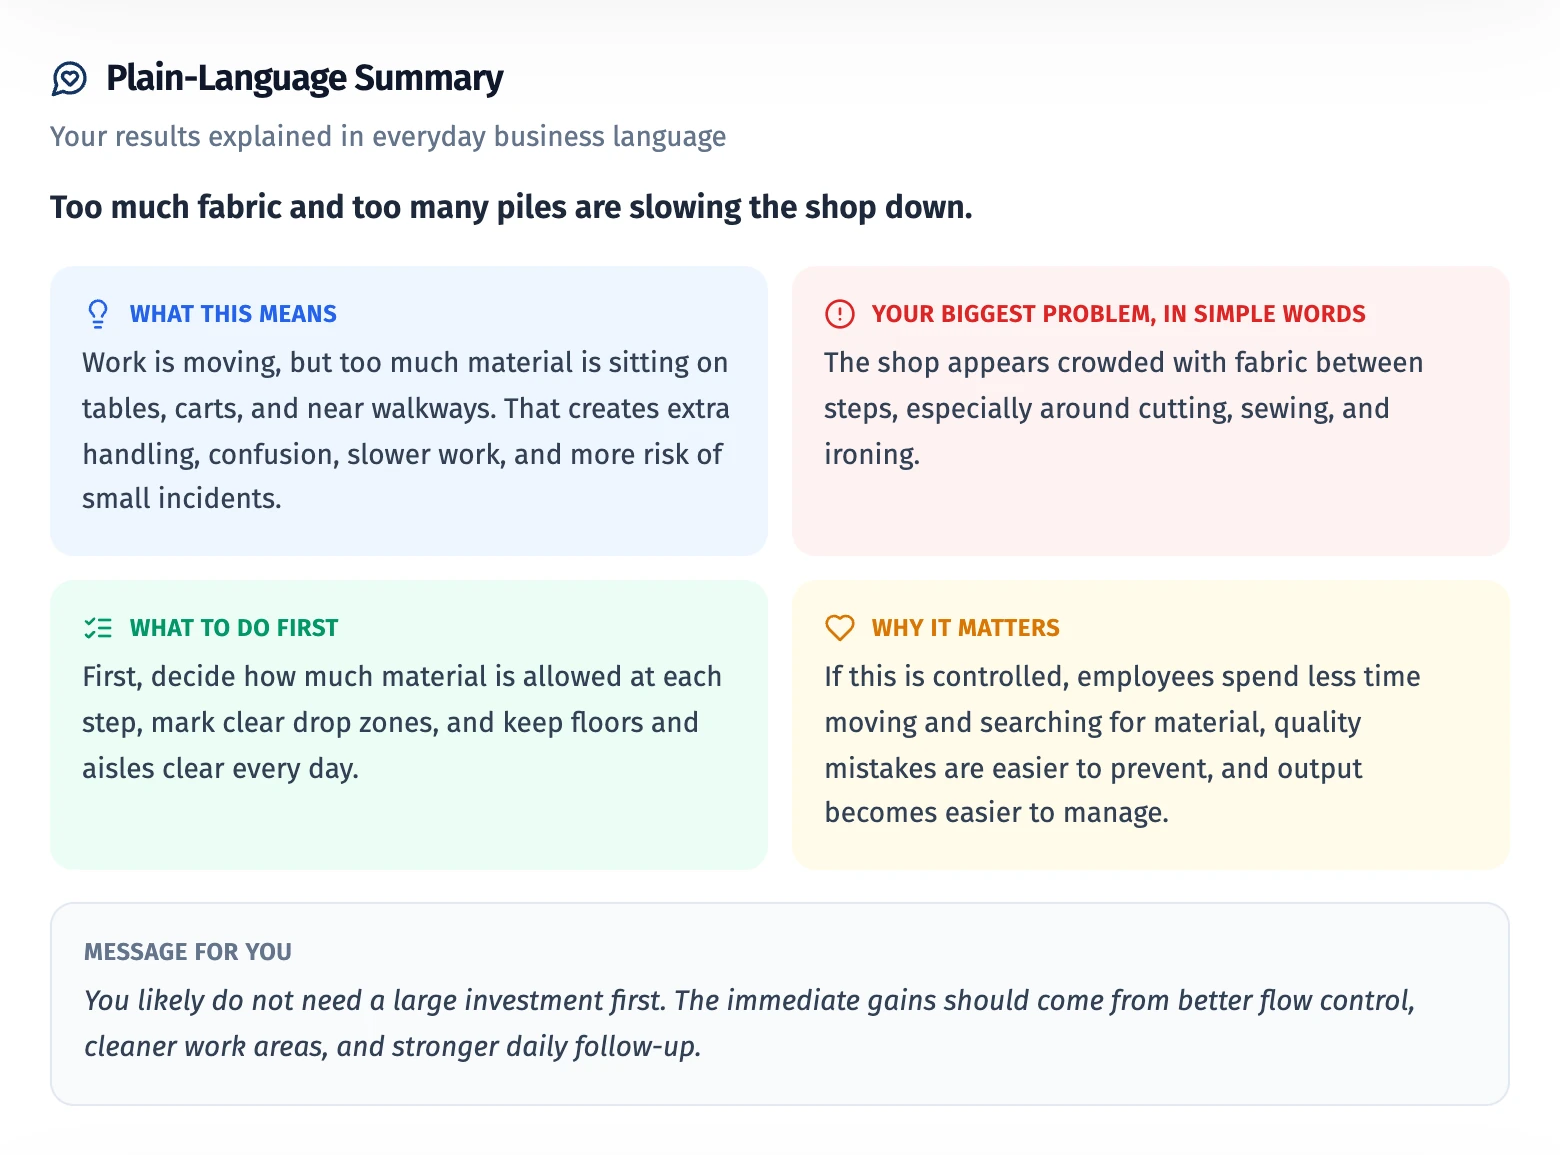
An executive summary for management and a plain-language summary for everyone: what it means, the biggest problem, where to start and why it matters.
07
Operational and financial roadmaps
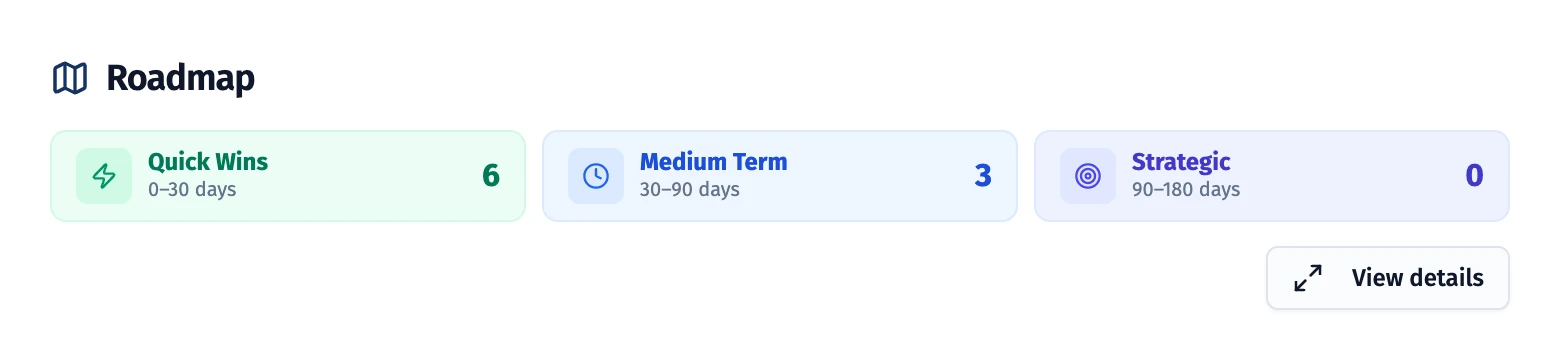
Actions are ranked as quick wins, medium term and strategic. The financial plan estimates each action's cost, savings and return when baseline data exists; otherwise, it says so.

08
Selection, assignment and Kanban
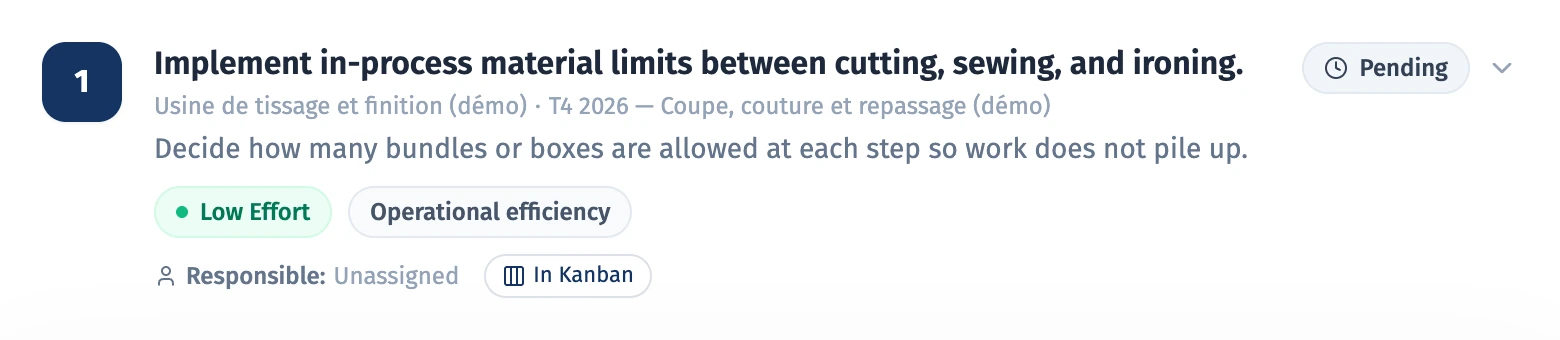
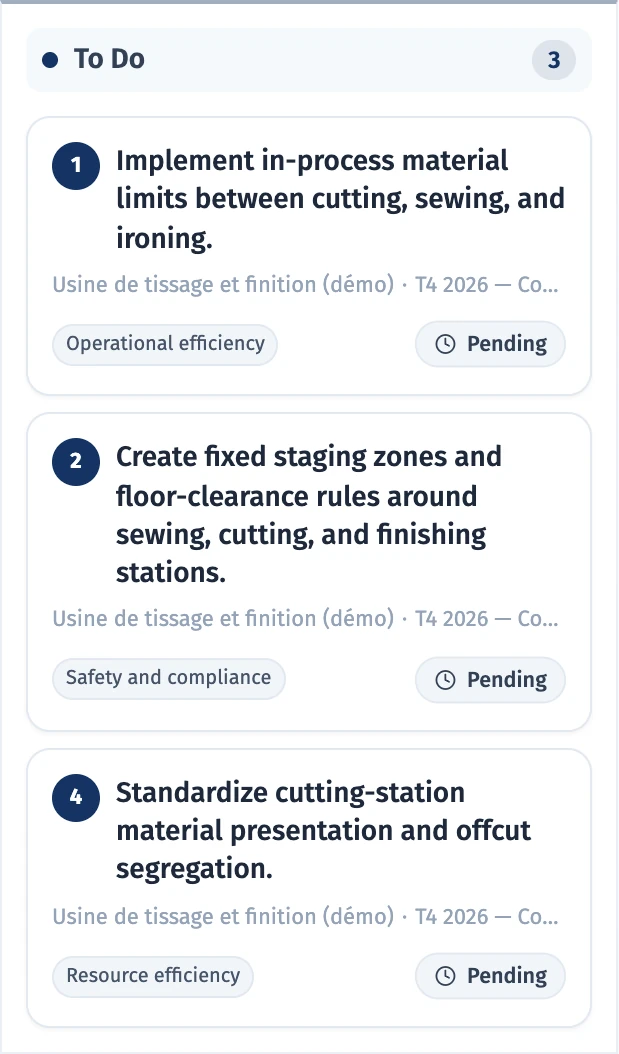
Your managers keep actions, name an owner and send them to the Kanban. Actions with due dates can appear in your calendar (iCalendar subscription).
09
Progress tracking and reports
The progress dashboard follows the score from one scan to the next, and the AI Coach points to the next best opportunity. PDF reports document progress or assess a portfolio of sites.


Getting started
A diagnostic in five simple steps.
No sensors and no industrial cameras: your knowledge of the floor, a questionnaire and the photos and videos taken with your own devices are enough.
- 01
Describe your context
Your company, your site and, if you wish, the objective of the diagnostic.
- 02
Answer the questionnaire
21 structured questions about your operations.
- 03
Upload your evidence
Photos and videos of your production floor.
- 04
Submit the scan
Review your answers and files, then start the analysis.
- 05
Take action
Review the findings, scores and recommended actions.
Consultant-style analysis
A structured reading, the way a consultant would deliver it.
PerforaScan organizes its analysis like a management report: ranked findings, scores, root causes, summaries for leadership and concrete recommendations.
- Structured findings, ranked by severity
- Scores across six performance pillars
- Root-cause analysis
- Executive summary and plain-language summary
- A confidence level for each piece of evidence
- Operational priorities
- Concrete, actionable recommendations
Demo diagnostic
- overall score
- 69%
- pillars assessed
- 6
- findings, 2 high priority
- 5
- prioritized operational actions
- 9
Fictional textile plant, demonstration data.
PerforaScan provides structured, consultant-style analysis. It does not replace the judgment of an experienced professional or on-site verification when the stakes are high.
Operational and financial improvement
Improvement opportunities, where they actually are.
Each finding links an observed situation to its business impact. You see where to act to improve performance and reduce avoidable costs.
01
Bottlenecks
The steps where production piles up or waits.
02
Material flow
Unnecessary movement, work in process and crowded areas.
03
Resource utilization
People, space and equipment that are underused.
04
Maintenance
Signs of recurring downtime and reactive upkeep.
05
Quality
Non-conformities, rework and their causes.
06
Avoidable costs
Losses that targeted actions can reduce.
Finding
Work in process is building up between cutting, sewing and finishing.
Recommended action
Implement work-in-process limits between cutting, sewing and ironing.
- High priority
- Low effort
From diagnosis to execution
Recommendations become a tracked plan.
01
Review
Management reviews the findings and proposed actions.
02
Prioritize
Actions are ranked by horizon and effort.
03
Assign
Each action you keep gets an owner.
04
Schedule
Due dates appear in your calendar.
05
Track
The Kanban shows what is to do, in progress and done.
06
Measure
The next scan shows the progress made.
Reports and follow-up
Reports ready to share.
With the Professional plan, generate PDF follow-up reports for management, audits or funding applications. Every plan lets you export a diagnostic's results as a PDF.
- Progress reportImprovement over time, across scans, findings and actions.
- Portfolio assessmentA consolidated operational review of several scans.
- In French or EnglishChoose the site, the period and the report language.
- Progress dashboard and AI CoachThe score from one scan to the next and the next best improvement opportunity.
- Calendar integrationActions with due dates in your calendar, through an iCalendar subscription.
AI, with your judgment
A diagnostic that shows where its conclusions come from.
01
Every observation cites its evidence
The analyzed file, the pillar concerned and a confidence level come with each visual finding.
02
No numbers without data
The financial plan only estimates a cost or a saving when baseline data allows it.
03
The decision stays human
AI-assisted diagnostics require human review. Your managers choose which actions to pursue.
See PerforaScan at work.
A guided demonstration, from uploading evidence to the Kanban.